Saturday, September 8, 2012

W8ing to cross 5630 SOOON!!

Well as I did mention earlier we r on the way up.... n once we cross above 5630...it will be confirmed 100%.In fact I expect to see 6000 in the next few weeks...

After completing wave 1(of wave c of wave B) we corrected.... and  are already in wave 3(of which we did wave 1... and then have been in a running correction which indicates a significant and strong upmove).

Tuesday, August 28, 2012

Well Sorry to have been unable to post for such a long time.However, I am still caught in some personal work... I still believe that overall the nifty is headed up....but what we are in is a part of a B wave on a yearly time frame... and the moves are corrective in nature and taking more time, also more complex ,.... tho we are headed up... it may or may not be unidirectional move.... as of now tho....if we cross above 5630 soon instead of taking too much more time.... then the move will be quicker and less complex.Lets see what happens tho.

In the meanwhile, I have spotted that earlier the Nifty n the USDX used to move in oppsite directions...we had a negative correlation.However, since around mid 2010 onwards... we have a positive correlation... as in the Nifty n the USDX move in the same direction.You can see the same from the charts below.Not very neat charts but still....


Tuesday, March 27, 2012

We are still to complete wave 2 and then go to wave 3

We are currently in wave 2... As of now I do not expect the same to go below 4985.It is taking a little longer than expected and the count is not very clear...but correctives can be like that.

Once wave 2 or b is over ... we shall go into wave 3 or c ... I expect it to be wave 3 ...which would be a set of 5 waves...and mostly 1.618% or more of wave 1(which was from 4588 to 5630.)unless... wave 1 will be the largest wave of the set of 5 waves of which we are in wave 2.... in which event it cud be 61.8% of wave 1(which was from 4588 to 5630)

I am caught up in some personal work and may not be able to update the blog for next 15-20 days.

Take care.

Monday, March 12, 2012

Wave 2 or b does not seem to be over

If we go below 5320/5300... it will be confirmed that wave 2 or b is not yet over.... n mostly we will then go lower than 5171..becoz then the b wave of the current move(2 or b) will hv gone lower than the low of a at 5268(this implies more bearishness).....still I do not expect the downmove to go below 4985 as of now.

If we cross above the high made today at 5420/30.... then the downside will not take place.

Wednesday, February 22, 2012

Nifty in wave 2 or b of current move

Well we seem to have completed wave 5 ... and the consolidation phase in wave 2 or b has started... confirmation of the same came when we went below 5545....

we shud correct either 23.6% or 38.2% or 50% or max 61.8% of the whole rise from 4588 to 5629....which comes to 5383(since wv5 began at 5365 we will go lower than this mostly),5231,5108,4985 respectively.

this consolidation shall take place in a 3 wave move.

Wednesday, February 15, 2012

Counting this move again


As of now ... it seems we r in wave 5 of 5...so this is the last part of wave 1....still one cannot be sure until a wave is over...lets see.

Tuesday, February 14, 2012

wave 1 or a not over yet.

I think that I was wrong to think wave 1 or a has ended... we are still in wave 3 of wave1.It has extended significantly and the gaps... confused me ... we will soon enter wave 4 which will give some downside n then go for wave 5 of wave 1... it seems.

One cannot be completely sure until a wave is complete tho.

Friday, February 10, 2012

Obvious upside not yet ended

When we made a new high yesterday, it was obvious that we are still going up...however, unless the current move extends...there may be very lil upside left.

Still, downside move will be confirmed only if we go below 5323.

Tuesday, February 7, 2012

Looks like Nifty possibly completed wave 1 or a

It does seeem that at todays high of 5413... Nifty possibly completed a set of 5 waves...so we can call that as wave 1 or a....If I am rite(n there are no further extensions) we shud now consolidate in wave 2 or b...which means we shud go somewhat lower.

If the correction is shallow n limited to 23.6% or 38.2% of the rise we shud go to 5220/5099 ...over the next few days... it wont be a one way downside... it will be a minimum of 3 waves a-b-c.

If it goes to 61.8% of the rise we can go to 4900.

Lets see.

Monday, January 23, 2012

LOWS R IN WHAT NEXT?

Well, we seem to have bottomed out at 4588 on 2nd JAN.The confirmation of a complete set of 5 waves and crossing above 5100 Nifty have not come in yet.However, looking at circumstances, chances are high that we have bottomed out.

So, on the assumption that we have bottomed out, checking out whats NEXT?

In the long term counts that I had put forth earlier, there were two options - either we are in wave Y or we are making a flat, in which case we are in wave B.

I am ruling out possibility of wave Y for now: reasons :
*We have retraced around 92% of the distance travelled by wave A at the Nov '11 high of 6338(a Flat corrective retraces more than 80% of wave A).
*The market tends to make a flat correction when the underlying force of the larger trend is strong, as in a structurally strong economy, which has the capacity to grow significantly once the correction is over.
*Lots of elections are due in 2012 as mentioned by Jim Rogers, so money printing would continue this year, in which case possibilty of going down towards the lows after an upside of around a 1000/1500 points on Nifty, seems low.
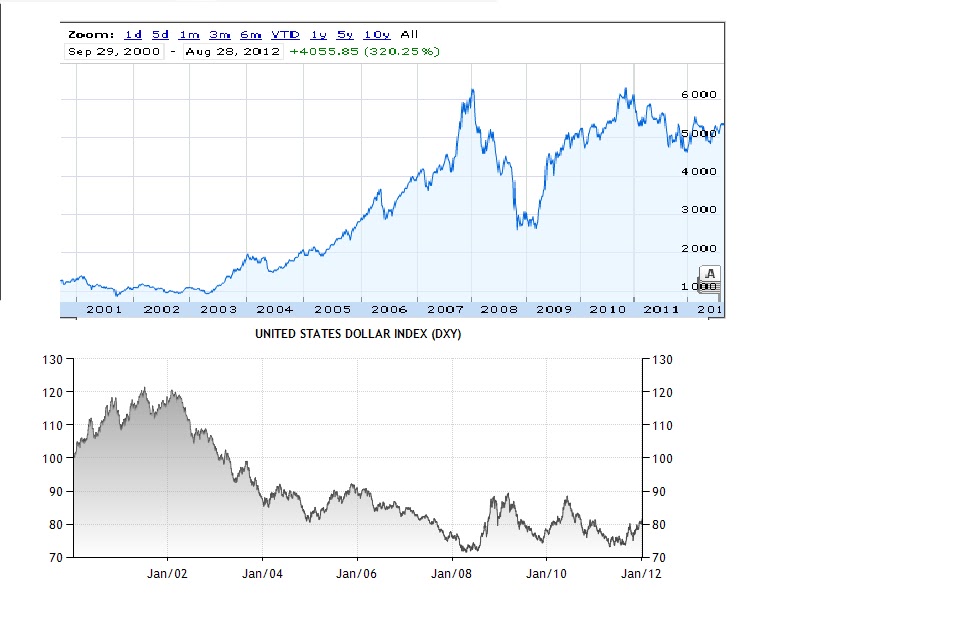
*As per me, as long as USD keeps going up overall(90/95 is where I see it going),world may remain in a risk-on mode....coz it implies that liquidity will remain for sometime.
*The lows were made by an ending diagonal, which is like a terminal triangle, breakouts from which tend to be strong in nature.
*Mind you, that this rally to my mind is more based on liquidity than on fundamentals and any event which makes liquidity collapse(as in money printing to stop) will certainly stop this rally.(SO LOOK OUT FOR THE SIGNALS FROM THE MARKET RATHER THAN ANYTHING ELSE, INCL. WHAT I THINK)

So that leaves us with the other possibility of making a FLAT, and hence, in wave B:
I am assuming we will make a new high, becoz not doing so will make the structure look like that of wave Y discussed earlier.

=>How far can wave B go?
*We have to see wave B in relation to wave A.(Wave A started in Jan 2008 and travelled from 6357 to 2253, but ended at 2539.This implies that wave B began at 2539)
*We also have to see the breakup of wave B,into 3 parts a,b and c (which is what we are in)( a went from 2539 to 6338.5, b went from 6338.5 to 4531 but ended at 4588, and c has mostly begun from 4588.)and their internal relationship.

* Seeing B in relation to A,
If B=A, we can go to 6643(we have already retraced 92% remember)
If B = 1.236 of A we can go to 7612
If B = 1.382 of A we can go to 8210(possibility of this is low for now)
B can also exceed 8210, possibility of this too is low, becoz it would lead to a running correction, for which the economy should be very strong, which does not seem to be the case.

So as far as B in relation to A is seen, we can go to 6643 or 7612 regions for now.

*Seeing the internal relationship between wave a and wave c of wave B:
If c=.5of a, we can go to 6488
If c= .618 of a, we can go to 6936
If c= .8 of a, we can go to 7628.

So far as wave c(of B) in relation to wave a(of B) is seen,we can go to 6488,6936,7628 regions.

All the above are open possibilities, one cannot predict where exactly the market will go, but it does seem that we will make a new high.Also, I do not see the market going above 7600/7650 region becoz,the fib ratios mentioned in bold above come in that region.

As of now I am not seeing the possibility of going to 8210 or above(but one never knows), as in such a case the wave C(the big one) may not retrace back to the lows of wave A(the big one)which is what happens in most(but not all flat corrections).
There are plenty of excesses in the Indian economy too(bubbles which have built up) which need to be corrected, which would not happen in case of going to 8210 or above,so I do not see that happening..... corrections normally break all bubbles.

Lets see what happens.

Clarification: I am not suggesting an immediate long or short. This is a long term view as in may take 9 months to a year or so to play out, depending on how high we go.

Tuesday, January 17, 2012

We cud hv made a bottom on low of 2 nd Jan


Whist it is possible that we made a bottom at the low of 4588 on 2nd Jan, it cannot be confirmed till we move above 5100...howevr the moves after making that low have been impulsive in nature.... yet, unless a complete set of 5 waves is made one cannot be sure.

If we have bottomed out then we will not go below 4781... n going above 5100 mite confirm a bottom.... Bank nifty seems to have broken out but it needs to go above 9273... for confirmation.

Unless we r continuing in wave d as of now... or making an extended ending diagonal in which case we wud be in wave b..doubtful... then we may not have made a bottom.

however, rite now... it seems that the lows may be in, need further confirmation in 5wave upmoves and...a move above 5100 nifty for the same.

Lets see.

Monday, January 2, 2012

Long term possible counts.


We are either in a FLAT or a DOUBLE ZIG ZAG....nt considering a 3rd possibility of a W-X-Y-X-Z for now.

As of now... I do not think that wave C has already started... the count does not go with it... however if we go below 4350/4300... I wud do a complete rethink.

Clarification: I shud be calling it a double three n not a double zigzag.