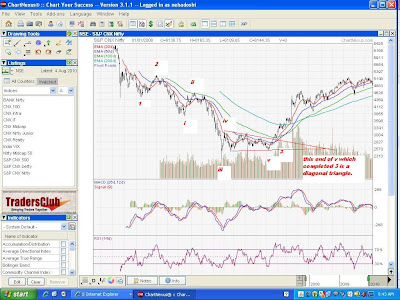
Mostly it seems to me that the B wave is a running correction... which has done abcxabc till date....with the last c still going on...after which it can be follwed by either another xabc or the BIG WAVE C... only time will tell.
The first abc is in the form of a zigzag.In which 'a' is from the low of 2539.45 made on 6.3.2009 to high of 4693.2 made on 12.6.2009.. followed by 'b' til the low of 3918.75 on 13.7.2009 which is 35.96% of a ( in a zigzag b can retrace as little as 1% of a)...followed by c which ends at 5310.85 which is equal to 64.64% of a( more than 61.8%)... satisfying the parameters of a zigzag.
After which the X wave ends at 4675.4 on 8.2.2010 which is less than 61.8% of the previous abc.
Thereafter the next abc is in the form of a flat.. which is fine as per the rule of alternation...of which a ends at 5399.65 on 7.4.2010...and b ends at 4786.45 on 25.5.2010...retracing 84.67% of a ( which is the normal b)... n the c wave is ongoing...
One will ahve to see if whenever c ends it satisfies all the parameters of a flat or not...else I will have to revise my count again.
The complete WAVE B made of abcxabc... has nearly retraced 81%( at 5577 it will be exactly that)of the WAVE A... in which case it might end up being a normal B wave...again only time will tell.
